What we'll cover
Inflation concerns and the Fed
Wages and the jobs market
Corporate earnings
Renewed recession jitters have cast a shadow over Wall Street and Main Street in the last few weeks. The year got off to a hot start with a strong 6% January rally in the S&P 500, but some of the gains were given back in February amid uncomfortably high inflation readings and a gangbusters jobs report that stoked rate-hike fears. In March, volatility kicked up after Federal Reserve (Fed) Chair Jerome Powell indicated that more rate hikes may be in the works to combat the rise in consumer prices.
The collapse of SVB Financial Group (SIVB) — also known as Silicon Valley Bank — along with the downfall of Signature Bank (SBNY) out of New York led to further volatility. .
So, it wasn’t exactly the Q1 that strategists saw playing out. Looking ahead, all eyes are on the banking sector, as well as what the Fed, along with other global central banks, might do to balance ongoing inflationary pressures with the chance of an economic downturn over the coming months.
The good news is that the employment situation remains strong while consumers continue to spend. Also, workers are beginning to earn wages that are keeping up better with inflation — and “real” wage gains are more likely as 2023 wears on.
If we indeed see inflation continue to cool and economic anxieties abate, the hope investors enjoyed in January could return and stocks may be poised for gains.
What else are we watching? Trends in corporate profits are always a key player in how stocks perform, and a drastic cut to earnings has yet to materialize, but earnings per share (EPS) forecasts are retreating. The second quarter will be key as important economic indicators will drive Fed policy. If we indeed see inflation continue to cool and economic anxieties abate, the hope investors enjoyed in January could return and stocks may be poised for gains.
The jobs picture
The January employment report sent shockwaves across Wall Street. A 517,000 rise in payrolls was much heftier than economists had projected. The unemployment rate sunk to lows not seen in more than 50 years, while average hourly earnings from a year ago rose 4.4%. The February report backed up January’s hot numbers. A strong labor market creates challenges for Fed members, as it’s arguably the biggest determinant of what inflation will be. But cracks are emerging.
Despite layoffs at major tech companies and in other sectors, weekly jobless claim figures continue to look healthy. In fact, the last 10 monthly employment-gain numbers have come in above the consensus forecast. Despite all the chatter of an imminent recession, the labor market continues to appear robust.
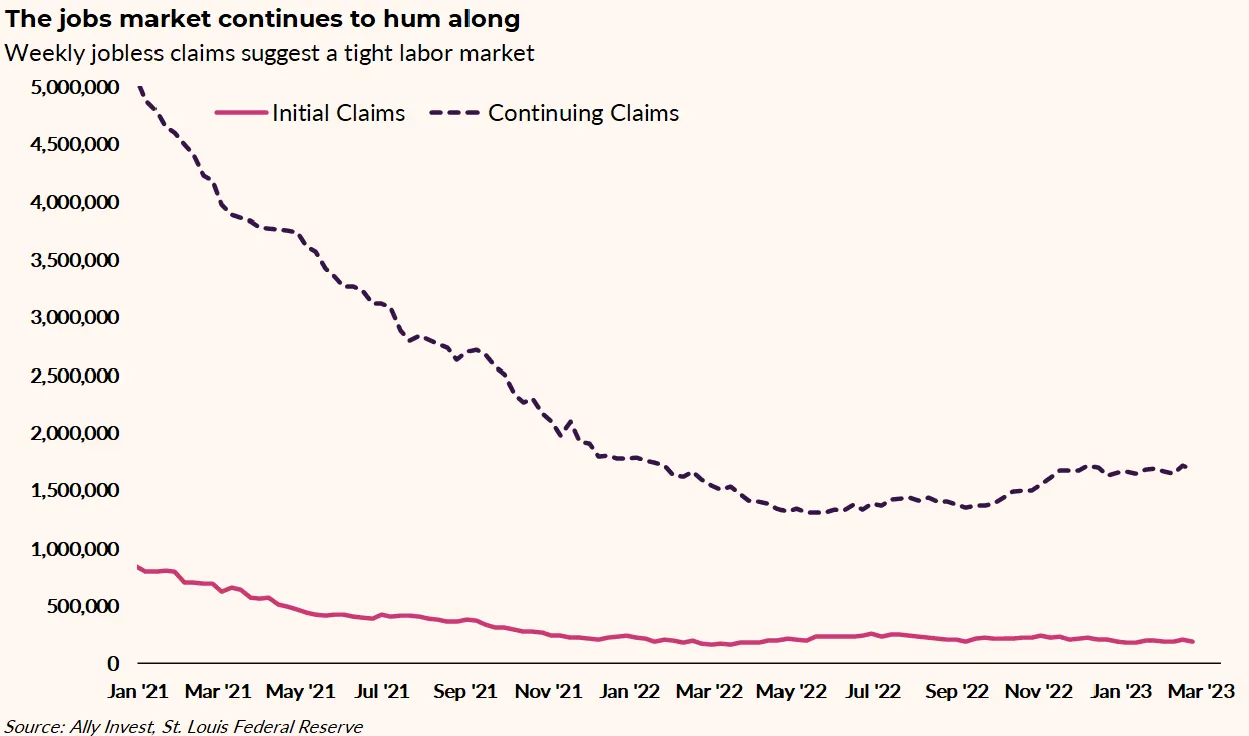
We expect a softening in the employment situation toward mid-year. If there are dips in net employment, that could give the Fed some wiggle room to ease off the economic brake pedal.
All eyes are on the Fed
In Q2, we will get just a pair of Federal Open Market Committee (FOMC) meetings — mark May 3 and June 14 on your macro risk calendars.
March madness in the financials sector has resulted in a much lower expected Fed Funds terminal rate — the peak interest rate set forth by the FOMC. Before the hoopla around domestic regional banks and the Credit Suisse fallout, the terminal rate was seen near 5.6%. Today, though, it’s back under 5%. Importantly for bond traders, rate cuts are expected to begin in June.
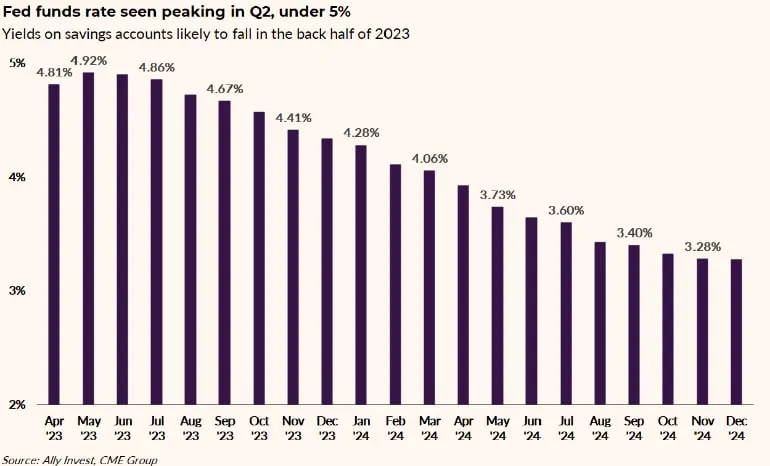
By the end of next year, we might be talking about a slew of policy rate decreases bringing the Fed Funds rate under 3.5%. That means savers, currently enjoying upward of 5% in money market mutual funds and certificates of deposit (CDs), could face significantly lower yields before long.
One key consideration for investors is reinvestment risk — the notion that you may have less attractive opportunities when you put cash back to work in stocks and bonds. Think through your asset allocation looking six months or a year ahead when yields could be on the decline. If you are holding cash that you have earmarked for investing in the market, one approach could be to dollar cost average in. This is a rules-based approach where you can invest periodically with a set dollar amount over specified time intervals that does not have to factor in which direction the market is moving — an approach that helps remove some of the noise and guesswork around investing in the market.
How will corporate earnings turn out?
Corporate earnings per share drive long-term stock returns, and while 2023 and 2024 profit forecasts are on the decline, fears of drastic takedowns of S&P 500 EPS this year and next haven’t yet come to fruition.
According to FactSet, full-year 2023 S&P 500 per-share profits are forecast to be $223. That’s down from the high last year, which was just above $250. As for 2024 EPS, $249 is the expectation, off from $278 almost a year ago.
Now, let’s do some math: If we take the S&P 500’s 10-year average price-to-earnings ratio of 17.3 and apply that to $249 of EPS, that yields a fair value near 4300 on the SPX by the end of the year. That is not an official prediction, but it gives us an idea of where the market could go in the coming months.
The bottom line
This year has featured innovations and events few had on their bingo cards. But amid everything, stocks are up on the year and sharply higher from Q3 2022. We will be watching what the Fed does in response to dampening inflation while the jobs market likely softens in the near term. Don’t forget about earnings season, which is on deck, too.
The market pullback from early February and sour investor sentiment right now could lay the foundation for a stock market recovery into the summer months.
Frank Newman is the director of portfolio construction and due diligence at Ally Invest. He oversees Ally Invest Wealth Management’s investment program, leading portfolio strategy and investment research functions. He is responsible for constructing goal-based portfolios tailored to clients’ unique needs and situations to help grow their wealth and navigate challenging market conditions with diversified and customized investment portfolios. With a background that has covered asset allocation, investment and fund research, trading operations and ongoing portfolio management, Frank has a passion for educating investors to help them stay the course with a long-term investment process and ultimately achieve their financial objectives.