Options trading is considered a more advanced investing technique for those who are attuned to the markets, are comfortable with taking risks and understand that, while options can provide diversification, they also have unlimited loss potential.
What are options?
If you're looking for a simple options trading definition, it goes something like this: Options trading gives you the right or obligation to buy or sell a specific security on or by a predetermined date at a set price.
Read more: Consider an Ally Invest Self-Directed Trading account for your DIY investing interests
Types of options
You can trade options via an online brokerage account, but before you start, you’ll want to form a solid knowledge base. You can begin by getting familiar with the different types of options you can trade. The two basic categories of options are calls and puts.
Put options
When you buy a put option, you have the right (but not the obligation) to sell the underlying security at a fixed strike price. As the seller of a put option, you have the obligation to buy the underlying security at a fixed strike price should the buyer choose to exercise the contract.
Put options (and call options — more on those below) can be American-style or European-style. With American-style options, the buyer can exercise the contract any time up to or on the expiration date. European-style options allow you to exercise the contract on the expiration date only.
Put option example
For example, say you buy a put option contract with a strike price of $50 (typically, a contract is for 100 shares) and a premium of $1 per share. Prior to the option's expiration date, the stock's price drops to $40 per share. If you exercise your option, you could still sell the 100 shares at the higher $50 per share price, and your net profit would be $10 x 100 (less the $1 per share premium) for a total of $900.
On the flip side, if the stock's price rises, you'll be out your premium of $100, plus any commission.
Let’s look at the seller’s side of this example: As the seller, you would receive the premium of $1 per share, regardless of the buyer’s decision to exercise the option. If they do exercise it, you would be obligated to buy the underlying security at the strike price of $50 per share, despite the stock price drop. Note that this process is often automatic if the contract is “in the money” (i.e. at a profit) for the buyer.
Call options
A call option gives you, as the buyer, the right, but not the obligation, to buy an underlying security at a designated strike price within a specific period. As a call option seller, you have the obligation to sell the underlying security at the designated strike price should the buyer choose to exercise the contract.
Call options also have expiration dates, which, like put options, have the same American vs. European rules. American-style can be exercised any time up to or on the expiration date, while European-style can be exercised on the expiration date only.
Call option example
For example, say you buy a call option with a strike price of $50 and a premium of $3 per share (remember, a contract is typically for 100 shares). This time, you’re hoping for a share price increase, so you can buy for less. If the stock's price climbs to $70 apiece, you could exercise the call option contract to buy that stock at a discount, saving yourself $1,700 ($20 x $100, minus the $3 per share premium).
If the stock's price dropped and the option contract expired, you'd still be out the premium cost of $3 per share, plus any commission.
From the seller's perspective, you would receive the premium of $3 per share, regardless of the buyer’s decision to exercise the option. If it is exercised, you would be obligated to sell (and this may occur automatically) the underlying security at the strike price of $50 per share, despite the rise in stock price.
Options terminology
Let’s talk about a few basic terms you should know when considering options trading.
Strike price: The strike price is the price per share of the underlying security when exercised
Expiration date: The expiration date is the date on which the option will expire
Premium: The premium is the cost to buy the options contract itself (and the amount the seller receives)
How does options trading work?
Unlike buying a share of stock where you own a piece of a company, an options contract is based on where you think that stock's price is headed within a specific timeframe. When you trade an option, you are essentially entering an agreement: As a buyer, you pay a "premium" for the right to buy or sell the asset at a predetermined price (the strike price) before or when the contract expires. Because one options contract typically controls 100 shares of the underlying stock, this method allows investors to gain significant market exposure with a relatively small amount of upfront capital, a concept known as leverage.
When an option reaches its expiration date and isn't exercised, it may automatically expire worthless (which means the seller loses the premium and possibly a commission, while the buyer receives the premium).
Basic options trading strategies
Once you've mastered options trading basic concepts, you may be interested in learning more about advanced options trading strategies. As you become more comfortable with options trading, your investing efforts may include some other commonly used techniques.
Covered calls
A covered call strategy has two parts: You purchase an underlying asset. Then, you sell call options for the same asset. As long as the stock doesn't exceed the strike price, you can realize profits by selling call options for your assets. On the flip side, even if the stock price does rise above the strike price, you would be obligated to sell to the buyer at the strike price if they exercised the contract.
Married puts
A married put (also known as a protective put) is a strategy to shield securities you already own from a market downturn. Think of it as a temporary insurance policy: You keep your shares (maintaining your long-term position), but the put option provides a guaranteed "floor" price where you can sell, protecting you from significant losses if the market dips unexpectedly.
Long straddle
A long straddle strategy involves buying a call and put option for the same asset with the same strike price and expiration date at the same time. You can use this approach when an investor is unsure which way prices for the underlying asset are likely to move.
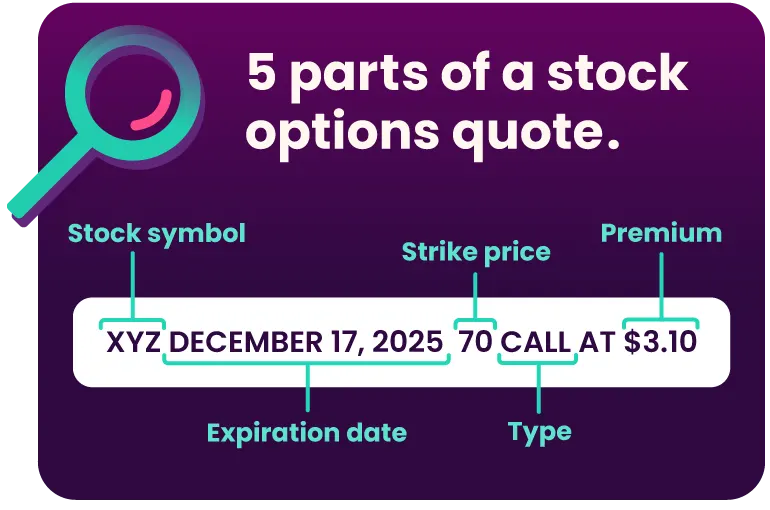
How to read a stock option quote
There are five parts of a standard stock options quote:
Stock symbol refers to what's used to identify the underlying asset attached to an options contract
Expiration date is the date on which the option will expire
Strike price is the price per share of the underlying security when exercised
Type refers to the type of option involved, i.e., call or put
Premium is the cost to buy the option's contract itself (and the amount the seller receives)
How options pricing is determined
You can calculate options pricing using two different models. But at its core, options trading prices are based on intrinsic value and time value.
An option's intrinsic value represents its profit potential based on the difference between the strike price and the asset's current price. Time value measures how volatility may affect an underlying asset's price until expiration.
The stock price, strike price and expiration date can all factor into options pricing. The stock price and strike price affect intrinsic value, while the expiration date can affect time value.
If you find terms like "intrinsic value" and "time value" confusing, think of an option premium like a car insurance premium. Just as car insurance is priced based on the probability of a future event (like a fender bender), option contracts are priced based on the probability of a stock rising or falling within a specific timeframe. Factors like driver age and history (similar to stock volatility) and the length of the policy (similar to the expiration date) all determine the final price you pay.
Why trade options?
As with any other investment strategy, options trading has its lists of potential benefits and risks, and it's important to understand these to try to avoid making costly mistakes.
Benefits of options trading
Here are some of the reasons investors consider options for their portfolios:
Leverage: Options trading tends to offer more flexibility, allowing you to invest with smaller amounts of capital. The risk of loss is if you’re required to buy or sell the security at the strike price
Hedging: Options might create downside risk protection and add diversification to your portfolio, though options trading comes with its own risk, sometimes unlimited
Income generation: Certain strategies may be used to gain profits, if successful, provide you’re comfortable with the associated risk of losing funds
Liquidity: Options (for certain stocks) may be more liquid than other investment vehicles
Risks of options trading
There’s a reason options trading is considered advanced. Here are some of the risks associated with this strategy:
Potential for loss: Options trading can be much riskier than other investments and can expose you to unlimited loss
Volatility: Volatility can wreak havoc on options pricing and can be difficult to predict
Complexity of strategies: Some options strategies are complex and require an advanced knowledge to execute properly — let alone turn a profit
Getting started with options trading
Should you choose to try options trading, these are the basic steps to get started. However, be sure you research all the variables, so you have a strong understanding of the concepts beforehand, as well as the significant, potentially unlimited, risk that comes with options trading.
1. Open a brokerage account with options trading capabilities
Opening a brokerage account differs from opening an options trading account, especially if you plan to trade on margin (borrowing money from your broker to trade). Options trading brokers may want to see your investment objectives, trading experience, personal financial information and types of options to trade. When considering an options or margin trading account, be sure to read and understand all the agreements and disclosures.
Brokerages often have different levels of options trading approval based on your experience and financial situation. Higher levels allow for more complex strategies.
2. Choose an options strategy based on objectives
There’s a huge variety you can choose from, so do your research on different strategies and stocks, make sure you’re aware of all the disclosures, and decide on the risks you’re willing to take before choosing a path.
3. Select your strike price
The strike price refers to the price at which the underlying security can be bought or sold (aka exercised) in your options contract.
4. Make your trade
Finally, the buyer pays the premium and broker commission and takes ownership of the contract, while the seller receives the premium and is now under obligation, should the buyer exercise the option contract.
Before you pursue options trading, consider how it aligns with your overall goals and risk tolerance, and take care to learn as much as you can before you dive into this advanced investing technique.